


Could You Survive a Market Crash and a Bad Year at Work?
Most portfolios are less diversified than they look. 2022 showed me why.
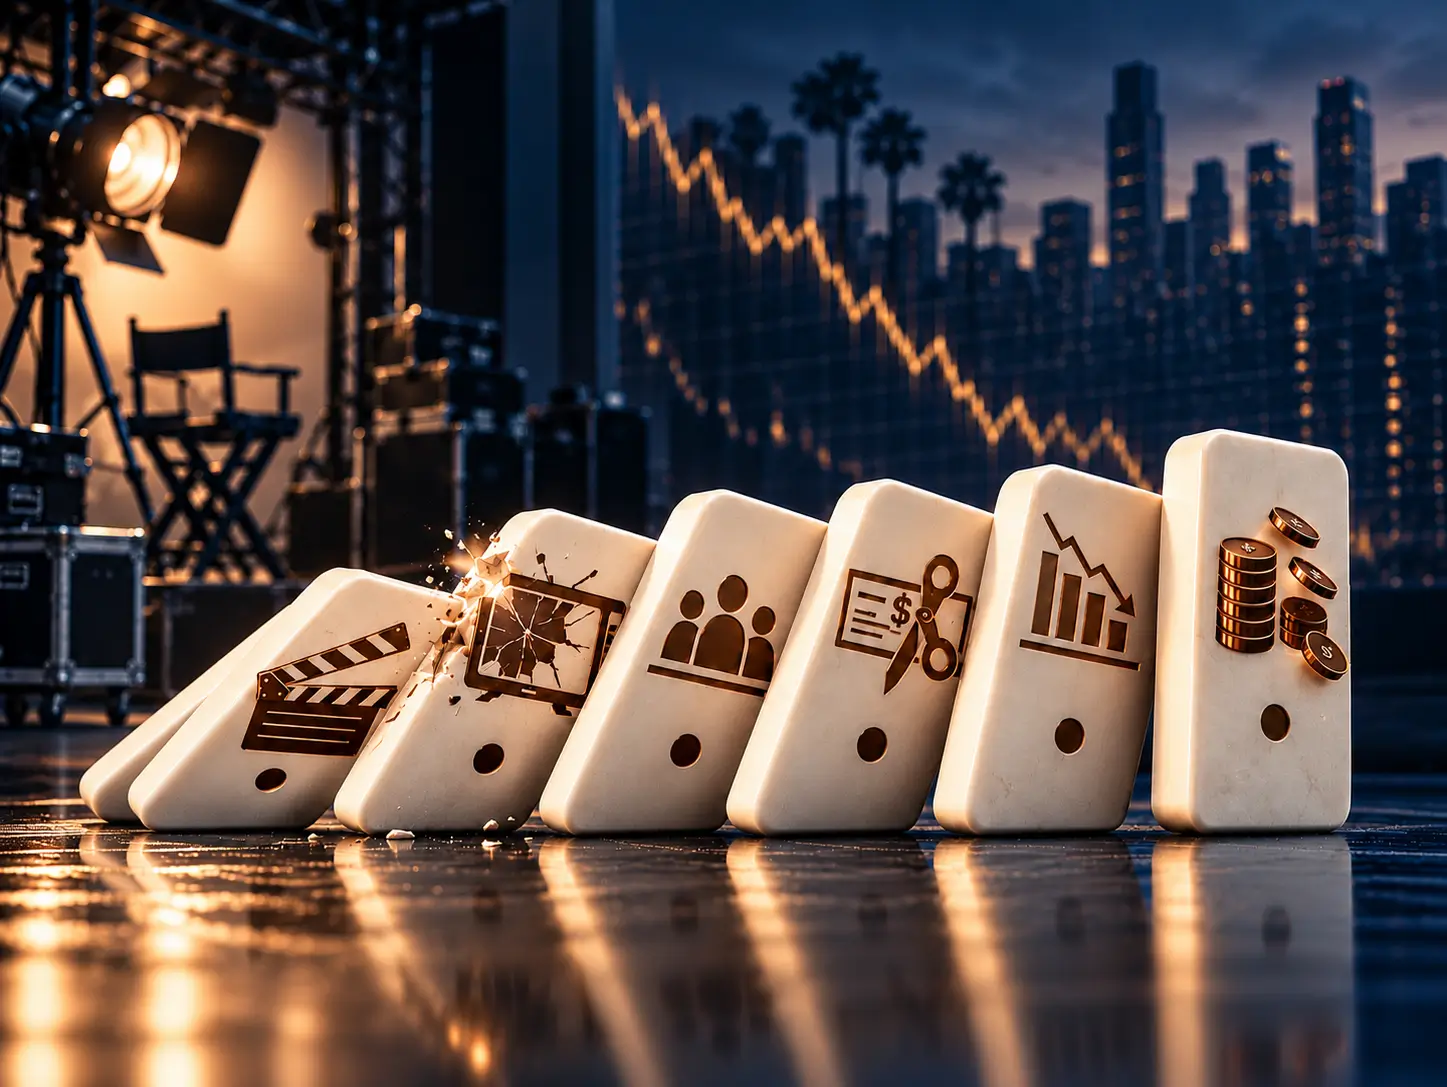
I spent 15 years in television. In April 2022, Netflix reported its first subscriber loss in more than a decade, and its stock fell 35% in a day. Within months, the whole entertainment industry shifted from chasing subscribers to chasing profits. Budgets tightened, shows got cut, and the work kept shrinking.
It never came back. Los Angeles County employment in film, television and sound recording is down nearly 40% from its 2022 peak, about 60,000 jobs, according to the Bureau of Labor Statistics. Nationally the industry is down about 28%, so this isn’t only an LA story.

Both incomes in my house came from the entertainment industry. Our savings were in the market, some of it in media and tech stocks. In 2022 our income and our savings took a hit at the same time.
That year changed how I define concentration. It isn’t just too much money in one stock. It’s when your investments and your income can fall for the same reason. It shows up as funds that hold the same companies, a paycheck tied to the same industries as your investments, or holdings that all fall at once when markets drop. This letter is about finding those overlaps, and fixing them, before a bad market does.
THE TL;DR
- Different funds can overindex in the same stocks. Look under the hood to see how big a position you may have.
- Your career is a position too. If your paycheck is tied to the same industries as your portfolio, you’re taking the same risk twice.
- A 40% loss requires a 67% gain to recover. That’s before you take a dollar out.
- Being forced to sell makes it worse. Shares sold at the bottom miss the recovery entirely, so the hole gets deeper.
- You may know your risk tolerance. You need to define your risk capacity. Tolerance is how much loss you can stomach. Capacity is how much your life can absorb before you’re forced to sell.
- Diversification means owning things that move for different reasons. Different asset classes, different strategies, different positions. In 2022, stocks, bonds and the entertainment industry all fell together.
The $2 Million Question
Imagine waking up to find a $2 million portfolio is worth $1.2 million.
That’s $800,000 gone. Could you handle it?
If you’re 45 with decades of earning ahead, the textbook answer is yes. You have time on your side.
But time only helps if you can stay invested, and staying invested depends on your paycheck holding up. For many people, the same downturn that hits their portfolio can also hit their income: a smaller bonus, fewer deals, slower business.
What Does a Crash Look Like?
| Market event |
S&P 500 peak-to-trough decline (approx.) |
|---|---|
| Dot-com crash (2000 to 2002) | -49% |
| Global financial crisis (2007 to 2009) | -57% |
| COVID crash (2020) | -34% |
| 2022 bear market (January to October) | -25% |
Are You More Exposed Than You Realize?
A 40% stock market crash doesn’t mean a diversified portfolio loses 40%. Bonds, cash and other holdings usually soften the blow. But plenty of portfolios that look diversified aren’t.
Here’s a hypothetical $2 million portfolio:
| Holding | Amount |
|---|---|
| S&P 500 index fund | $600,000 |
| Nasdaq-100 fund | $400,000 |
| Large-cap growth fund | $300,000 |
| Bond fund | $300,000 |
| Technology sector fund | $200,000 |
| Individual tech stock | $200,000 |
Six holdings. Now look at what’s missing: no international stocks, no value stocks, no smaller companies. All four stock funds buy the same kind of stock: large U.S. companies. And when you look inside them, the same few stocks show up in all four.
The ten largest holdings in the S&P 500 make up about 39% of the index, according to State Street’s S&P 500 fund as of October 13, 2026, a level of concentration S&P Dow Jones Indices says hasn’t been seen since the mid-1960s. That puts about $235,000 of the S&P 500 fund in ten holdings. Run the numbers using four widely held funds and their holdings published between June 30 and October 13, 2026, and just three companies, Nvidia, Apple and Microsoft, account for roughly $400,000 of this portfolio. Four funds that look like four separate decisions put about one-fifth of your money in the same three stocks.
Today much of that weight rides on one theme: AI. If enthusiasm for it cools, all four funds feel it at once, including the S&P 500 fund most people count on to be the diversified one.
Finding the Nvidia, Apple and Microsoft total took four fund documents and a spreadsheet. Few people do that math, which is why few know their own overlap. If you can’t say, off the top of your head, how much of your portfolio sits in the same ten companies, you’re in the majority.
And that doesn’t count the individual tech stock: another $200,000, or 10% of the portfolio, in one company.
What Moved Differently in 2022
A portfolio built this way works until stocks and bonds fall at the same time. That happened in 2022. For the full year, the S&P 500 fell 18%. The Nasdaq-100 fell 32%, and this portfolio has $400,000 in it. The broad U.S. bond index fell 13%, its worst year since the index began in 1976. A traditional 60/40 mix of stocks and bonds had nowhere to hide. In the hypothetical portfolio, the only cushion is a $300,000 bond fund.
Here’s how different investments did:
| Investment | 2022 full-year return |
|---|---|
| Large U.S. growth stocks (Nasdaq-100) | -32.4% |
| Large U.S. stocks (S&P 500) | -18.1% |
| U.S. bonds (Bloomberg U.S. Aggregate) | -13.0% |
| Large U.S. stocks, equally weighted (fund) | -11.6% |
| Value stocks (Russell 1000 Value) | -7.5% |
| Hedge funds (HFRI Fund Weighted Composite) | -4.2% |
| Commodities (Bloomberg Commodity TR) | +16.1% |
| Managed futures (SG Trend Index) | +27.3% |
The $2 million portfolio above owns nothing from the bottom five rows.
Two lessons sit in that table.
First, not all stock funds behaved the same way. An equal-weight fund gives every company in the S&P 500 the same weight, so a few giants don’t dominate it. A value index leans toward companies priced low relative to their earnings. Every stock investment in the table fell in 2022, but the losses ranged from 32% for the Nasdaq-100 to 8% for value. Same market, different results, depending on what the fund held and how it was weighted.
Second, some investments move for different reasons than stocks and bonds. Managed futures, which follow price trends up or down across commodities, currencies and interest rates, gained 27% in 2022 while stocks and bonds fell together. Commodities rose 16% as inflation climbed.
None of these strategies is a free lunch. Hedge funds as a group still lost about 4% in 2022: far better than stocks or bonds, but nowhere near the best performers. Managed futures can struggle when trends reverse, commodities are volatile, and alternatives can carry higher fees and limited liquidity. What worked in 2022 may not work in the next downturn. The point isn’t to build a portfolio that would have won in 2022. It’s to build one that doesn’t depend on any single market environment.
Same Portfolio, Different Risk
That’s the portfolio. Now the paycheck.
If the $200,000 tech stock you own is your employer’s, one bad quarter can hit your shares and your job security at the same time. And even if you don’t own your employer’s stock, the same downturn that hits your portfolio can hit your income too.
If you sold real estate in 2008 with your savings in house flips, the same crash cut your commissions and your savings. If you work in tech, your bonus and equity pay may ride on the same companies your funds own. If you own a business, your customers may pull back in the same downturn. If you work in film or television, you’ve already lived it: your deal flow or staffing depends on studios and streamers that tighten budgets the moment their own businesses are under pressure.
Meet two 45-year-olds. Both own the $2 million portfolio above. For this stress test, assume each portfolio falls 40%, the kind of loss a portfolio this stock-heavy could take.
| Investor A | Investor B | |
|---|---|---|
| Income | Steady salary | Bonus, equity pay or deal-based |
| Cash reserves | About a year of expenses | About two months |
| Fixed costs | Moderate mortgage | Large mortgage, private school |
| Portfolio after the drop | $1,200,000 | $1,200,000 |
Investor A works in a field that doesn’t rise and fall with the stock market. No job is guaranteed, but her salary keeps covering the bills and her reserve covers surprises. Her portfolio is down $800,000, but her day-to-day life barely changes. She stays invested and waits.
Investor B has the same $800,000 loss and a different problem. The downturn that hit his portfolio may also hit his bonus, his equity pay or his next deal. If it does, two months of cash runs out fast against a large mortgage.
A high income does not guarantee a cushion. More than a third of survey respondents with household incomes above $300,000 say they primarily live paycheck to paycheck, according to a 2026 Goldman Sachs Asset Management survey.
When the cash runs out, he may have to sell. Say he sells $200,000 of stock near the bottom to cover the gap. That money is spent. The bigger problem is what the shares he sold would have done next.
His remaining $1 million now needs a 100% gain to get back to $2 million. If the market delivers its 67% recovery, he lands near $1.67 million, about $333,000 behind Investor A. Roughly $200,000 of that gap is the money he withdrew. The other $133,000 is the rebound the shares he sold at the bottom never got to see.

Missing the rebound is the damage that can last. A paper loss may recover. A forced sale can lock part of the loss in. And recoveries can take years. After the dot-com crash, the market stayed below its old high for more than six years, even with dividends reinvested. After the 2008 crisis, it took nearly five. Two months of cash won’t last through a five- or six-year recovery.
Investors A and B could feel exactly the same watching their balances fall. The difference is that A can afford to wait, and B might not.
That’s the gap between risk tolerance and risk capacity. Risk tolerance is how much loss you can stomach. Risk capacity is how much your life can absorb before you’re forced to sell. Most people have filled out a risk-tolerance questionnaire that labels them aggressive or conservative. Far fewer have ever defined their risk capacity.
So, which investor are you? A or B? Better to find out before the market tells you.
Define Your Risk Capacity Before the Market Does
To run the same test on yourself, ask these questions:
- What happens to my portfolio if stocks fall 40%?
- What happens to my income in the same downturn: salary, bonus, equity pay, deals or business revenue?
- How many months could I cover my fixed costs without selling anything?
- If I had to raise cash, what would I sell first, and at what loss?
- Would I have the cash and the discipline to rebalance while everyone else is selling?
A stress test isn’t a forecast. It uses historical relationships and reasonable assumptions to show how your holdings, and your income, might behave in a bad market. It can’t tell you when the next crash comes, only whether you’re ready for it.
Build the Plan Before You Need It
You can’t control when the crash comes. You can control whether it forces your hand.
So what does Investor B do? Four things. First, build his cash reserve to six months or more before adding another dollar to stocks, because reserves are what let him wait. Second, trim the overlap and add what’s missing, so his stock funds aren’t all leaning on the same large U.S. companies. Third, diversify across asset classes that don’t depend on the same industry as his paycheck, so a bad year at work is less likely to hit everything he owns. Fourth, unwind the single stock over several tax years instead of all at once. Every one of those steps depends on his income, his reserves and his tax picture, which is why no fund can do them for him.
Fixing concentration is rarely as simple as hitting the sell button. If your exposure sits in company stock or a position you’ve held for years, reducing it without triggering a substantial tax bill takes careful planning.
Final Thoughts
Could you survive a 40% drop in the same year as a bad year at work? That comes down to two things: a portfolio that doesn’t fall for the same reasons your paycheck does, and enough cash that you never have to sell at the bottom.
Then comes the hard part: sticking to the plan when every instinct says sell. That’s easier with the plan written down before you need it, and someone whose job is to hold you to it. No one can promise a better outcome, but nobody makes their best decisions at the bottom.
If you’re not sure whether you’re Investor A or Investor B, reach out. We’ll look at what your portfolio actually owns and how much cushion you have, before the market tests it for you.
This material is provided for general informational and educational purposes only and does not constitute investment, legal, or tax advice. It should not be construed as a recommendation to buy, sell, or hold any particular security or to pursue any specific investment strategy. Views expressed are current as of the date of publication and are subject to change without notice. Past performance is not indicative of future results, and no guarantee is made or implied regarding investment outcomes. Regatta Capital Group is an SEC-registered investment adviser; registration does not imply a certain level of skill or training, nor does it constitute an endorsement by the SEC. Please consult your advisor to discuss how this information applies to your individual circumstances. Form ADV Part 2A and Form CRS are available on request.
The $2 million portfolio, Investor A, Investor B, the forced-sale math and the Investor A versus Investor B chart are hypothetical illustrations. They are not actual clients, results, projections or recommendations. They assume a 40% decline, a $200,000 sale near the bottom and a 67% recovery, and they do not reflect taxes, fees, trading costs or actual investor experience. Hypothetical results have inherent limitations, and actual results will differ. Investor B’s four steps describe a hypothetical person, not a recommendation to the reader. The stress test questions are general, are not a forecast and are not a personalized assessment. The Los Angeles County jobs chart uses actual Bureau of Labor Statistics data, seasonally adjusted by the Federal Reserve Bank of St. Louis.
Historical declines and 2022 returns are shown for context only. The market decline table shows price-only S&P 500 declines from peak to trough and excludes dividends. The 2022 full-year figures are index total returns, which assume reinvested dividends and do not reflect fees or expenses. Indexes cannot be invested in directly. The equal-weight figure is a publicly traded fund’s return net of fees. The SG Trend Index reflects net returns of a group of managed futures managers. The HFRI Fund Weighted Composite reflects self-reported hedge fund returns, net of fees, and is subject to revision. Hedge funds are generally available only to qualified investors. Calendar year 2022 shows one period when stocks and bonds fell together. Other periods produced different results.
Alternative strategies, including managed futures, commodities and hedge funds, involve risks such as volatility, leverage, higher fees, limited liquidity and complexity, and may not be suitable for all investors. Diversification and asset allocation do not ensure a profit or protect against loss. Statements about possible future events are not predictions.
Fund holdings and weights come from published fund documents as of dates between June 30 and October 13, 2026, change over time and are shown only to illustrate concentration. Naming Nvidia, Apple or Microsoft is not a recommendation to buy or sell any security.
Third-party data comes from the Bureau of Labor Statistics, Federal Reserve Bank of St. Louis, S&P Dow Jones Indices, State Street, Nasdaq, Bloomberg, FTSE Russell, Hedge Fund Research, Societe Generale and Goldman Sachs Asset Management. It is believed to be reliable but is not guaranteed for accuracy or completeness. The Goldman Sachs figure comes from a July 2026 survey in which respondents chose among descriptions of their finances, including primarily living paycheck to paycheck and struggling to make progress on long-term goals. Results are self-reported. Tax treatment depends on individual circumstances and future law. Consult a tax professional.
Contacting Regatta Capital Group to review your portfolio does not create an advisory relationship. An advisory relationship begins only when you and Regatta sign an advisory agreement.
Artificial intelligence tools were used in preparing portions of this letter, including drafting assistance, research support and the preparation of the charts. [All figures, citations and dates were independently verified,] no client information was used, and the letter was reviewed and approved by Regatta Capital Group personnel prior to distribution.


